
Today I will take you through a manual cost audit in an AWS account. I have a sandbox account that is used by multiple users in my company. It is totally unregulated and its time I did a cost auditing of my sandbox account. The outcome of this audit that I expect are:
- What are the major cost drivers for my AWS account?
- Which component in the major cost driver is costing me the highest?
- How can I put accountability in the incurred cost?
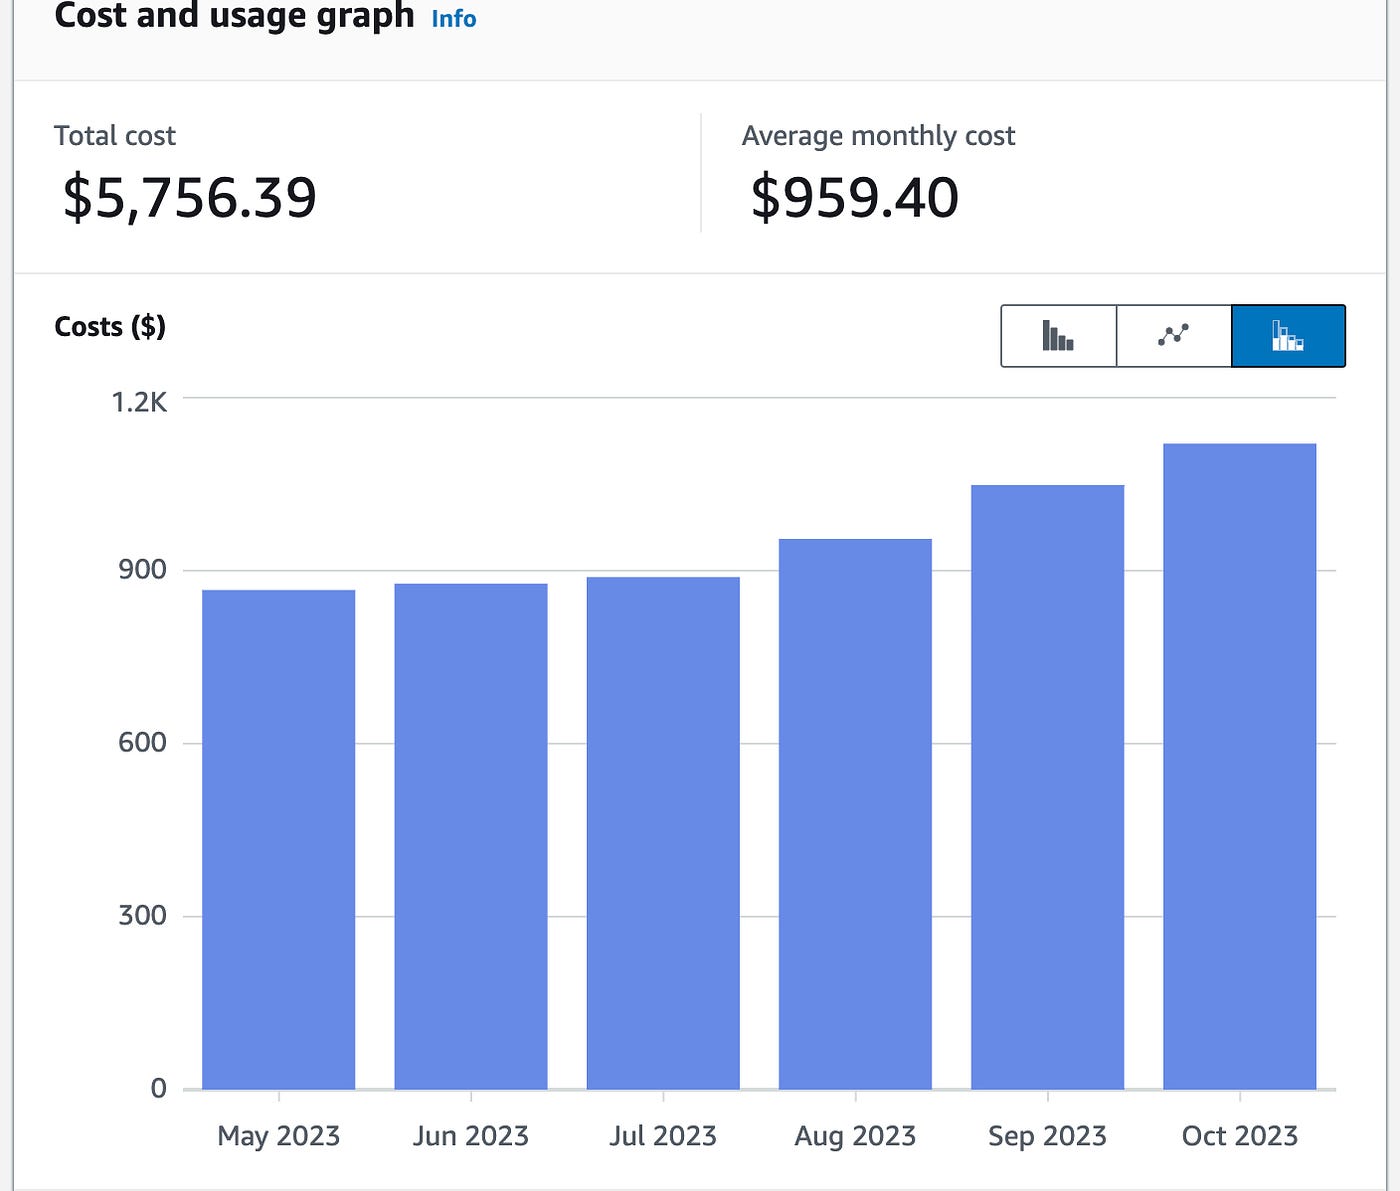
First thing’s first. What is the cost incurred in this account currently? Well, it averages $959.40 over last six months. A total of $5756.36 has been spent over the last six months.
So now lets start the diagnosis in this account. Lets start with the first question.
What are the major cost drivers for my AWS account?
To find this out, go to AWS Cost Explorer service and put the filter parameters as shown in the picture below.
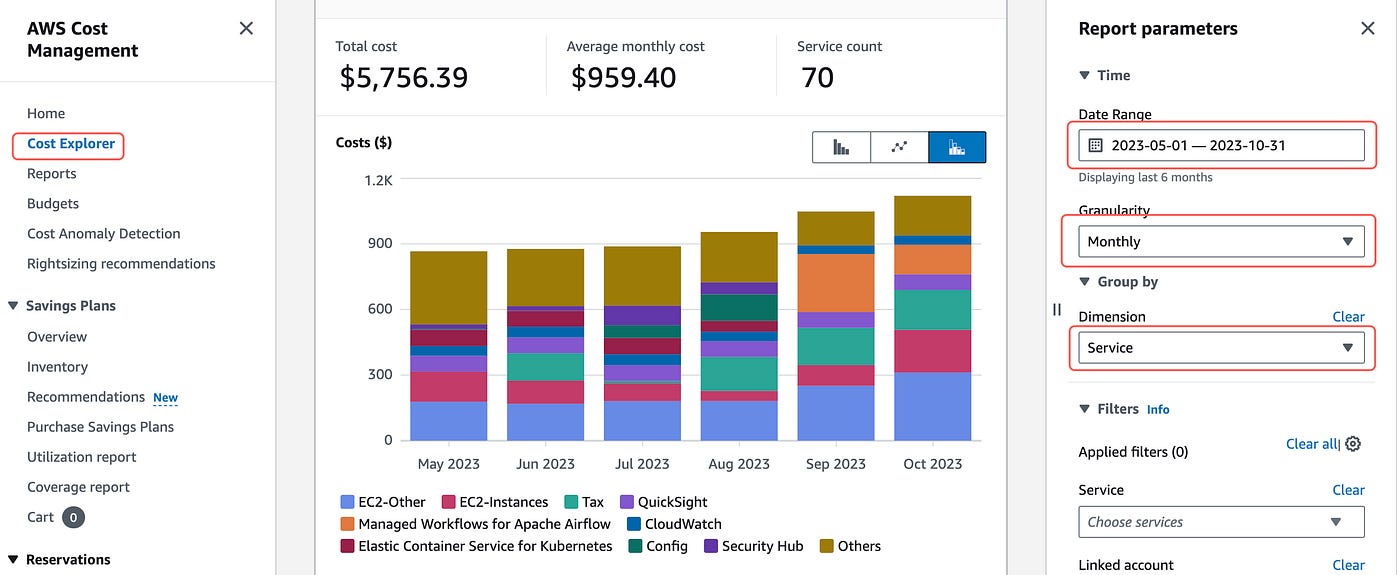
Here if we look in October, one of the biggest cost driving element is EC2. The EC2-Instances and EC2-Others components collectively comprise of total cost incurred by EC2 service. Another one in orange, that has been seen in September and October, is Managed Workflows for Apache Airflow. And mind you, there has been a lot of tax to be paid as well.
So the biggest cost drivers are:
- EC2-Instances
- EC2-Others
- Tax
- Apache Airflow
Lets dive deeper. How much is the EC2-instances and EC2-others category costing us? Just put the filter as shown below and you can filter that information out.
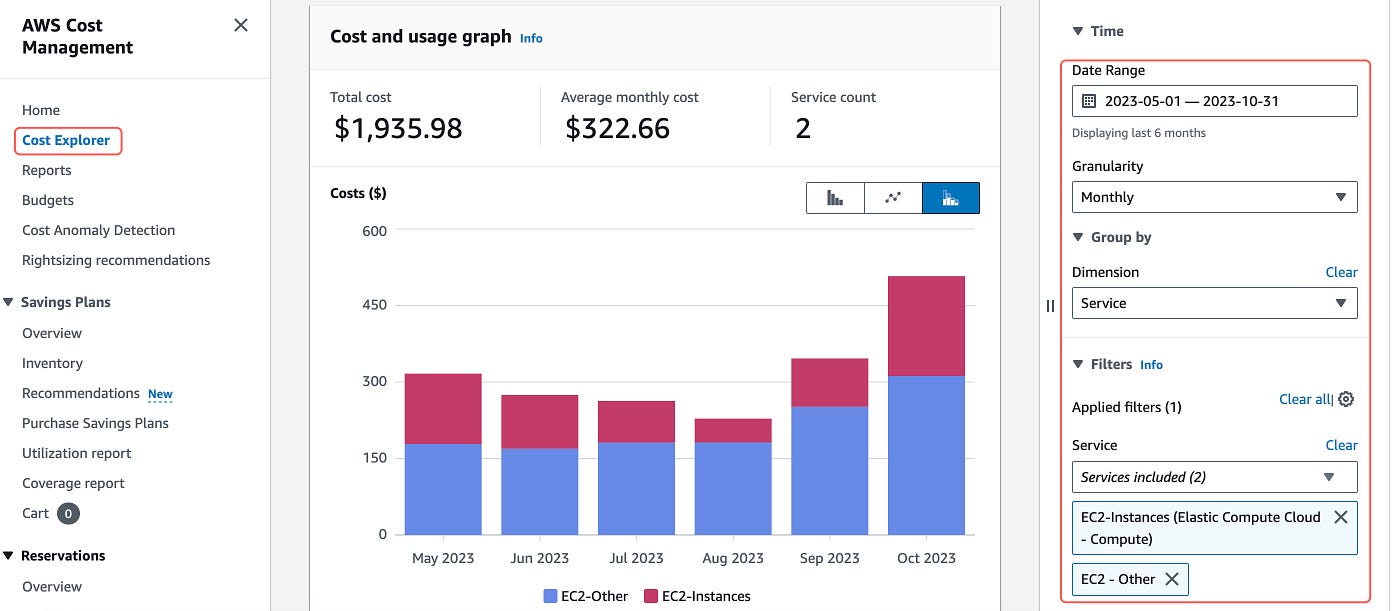
So EC2 is costing us about $322 per month. That is about 33.6% of total average monthly cost this sandbox account is incurring. But whats the difference between EC2-instances and EC2-Other?
EC2-Instances section covers only the compute part of EC2. But there are so many other parts such as EBS volume, Elastic IP addresses, NAT Gateways, Load Balancers, so on and so forth which incur costs as well which is covered by the EC2-Others section. To know in depth about what EC2-Others comprise of, check out my previous blog What’s Hiding Behind ‘EC2-Other’ Costs in AWS: A Guide to Smarter Cloud Spending.
Now lets dive deeper into the EC2-Instances section.
First of all, we need to identify which regions the instances are running on. To do that, just go the Billing service of AWS.
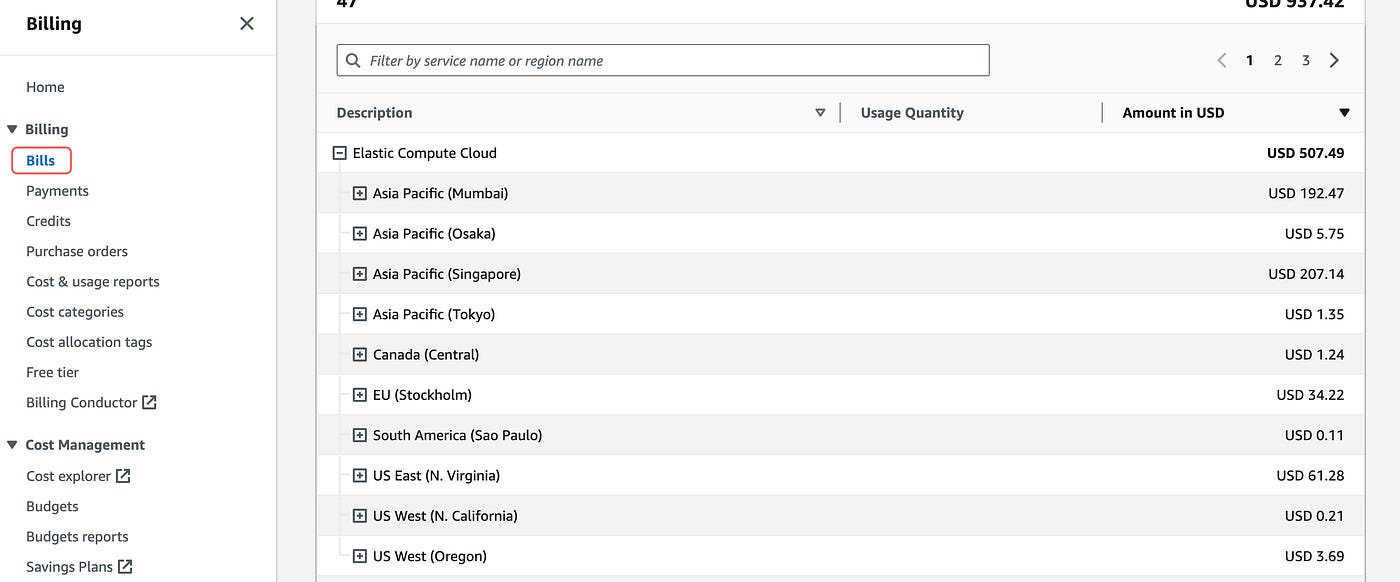
Now thats a lot of Regions EC2 is incorporating costs on!!! Among these, we are incurring high levels of cost in Singapore, Mumbai, North Virginia and Stockholm region (Considering 2 digits or greater as high levels of cost).
Lets start from Singapore then. Lets expand Singapore.
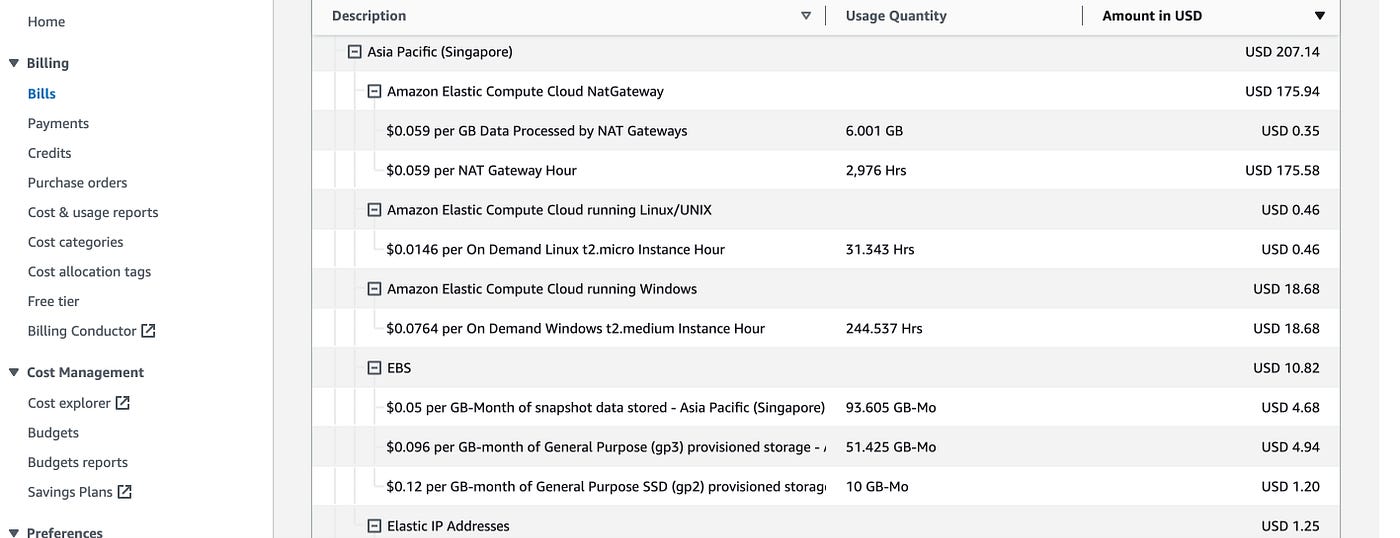
The first cost category is NatGateway cost. It has incurred USD 175.94 (2,976 hrs with $0.059 per hour charge). Now if you think about it, there are 730 hours in a month (not exactly, but thats what AWS considers and is close enough). But our usage shows 2,976 hrs this month. So this implies there must be multiple NAT Gateways.
In the second category there is EC2 running Linux/UNIX and in the third category there is EC2 running windows. Something doesn’t add up here.
Why are there multiple NAT Gateways and not that much usage of EC2 instances? This calls for a red flag and a checkup. Why? Because NAT Gateway is used to connect to internet from private subnets but internet cannot access those resources. If there are no EC2 instances, then why are there so many NAT Gateways? So lets jump into the VPC section in Singapore region to look at these NAT Gateways!
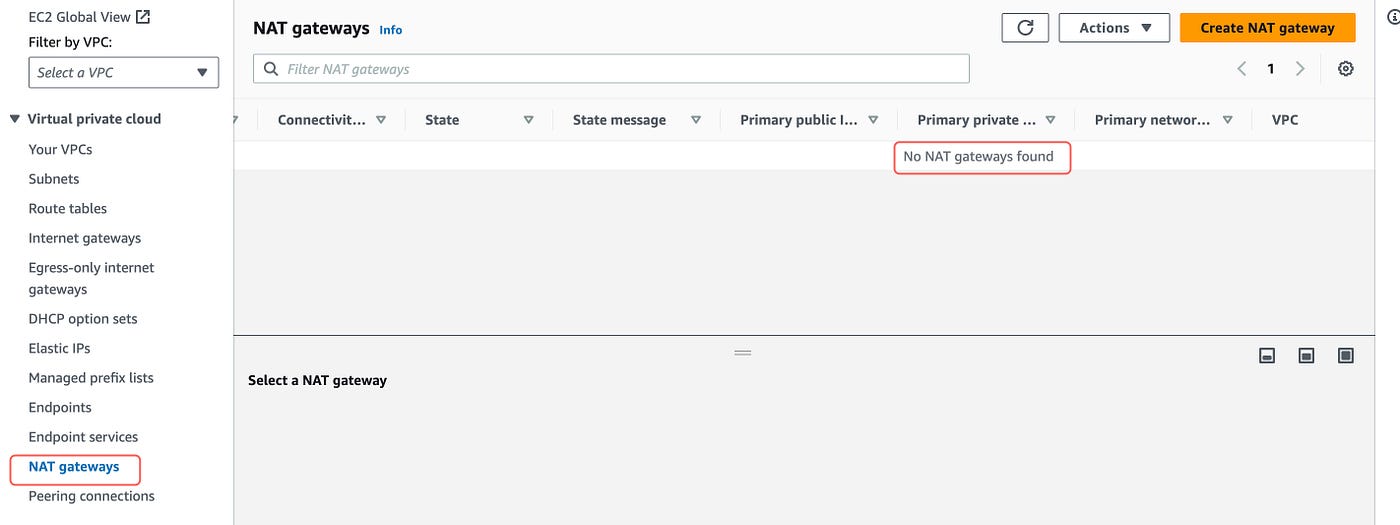
To my surprise, I found no NAT Gateways in the Singapore region!!! So what happened? Someone removed the NAT Gateways. Who did it? When did they do it? Lets find out. Lets start with the when.
The incurred cost is for the month of October. And today is just few days past October. And we know, NAT gateway’s cost is added in the EC2-Others cost section from my previous blog What’s Hiding Behind ‘EC2-Other’ Costs in AWS: A Guide to Smarter Cloud Spending.
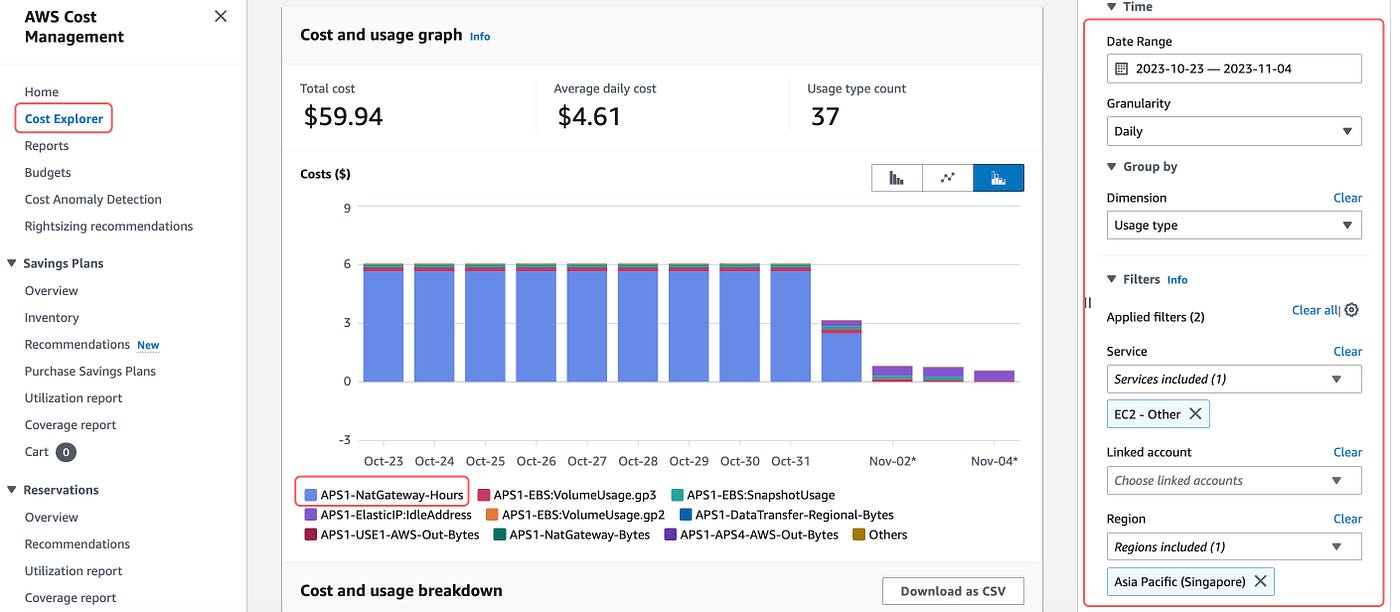
So lets see the cost incurred daily in the EC2-Others section in last 10 days, with a granularity level of Daily. To do that just put the filters shown in the picture below in AWS Cost Explorer.
Hello hello! What can we see here? It seems on October 30, the resources were deleted as it has been stable before that but the cost has started coming down from that day. And 2 days later, Nat gateways were removed which brought down the EC2-Other cost.
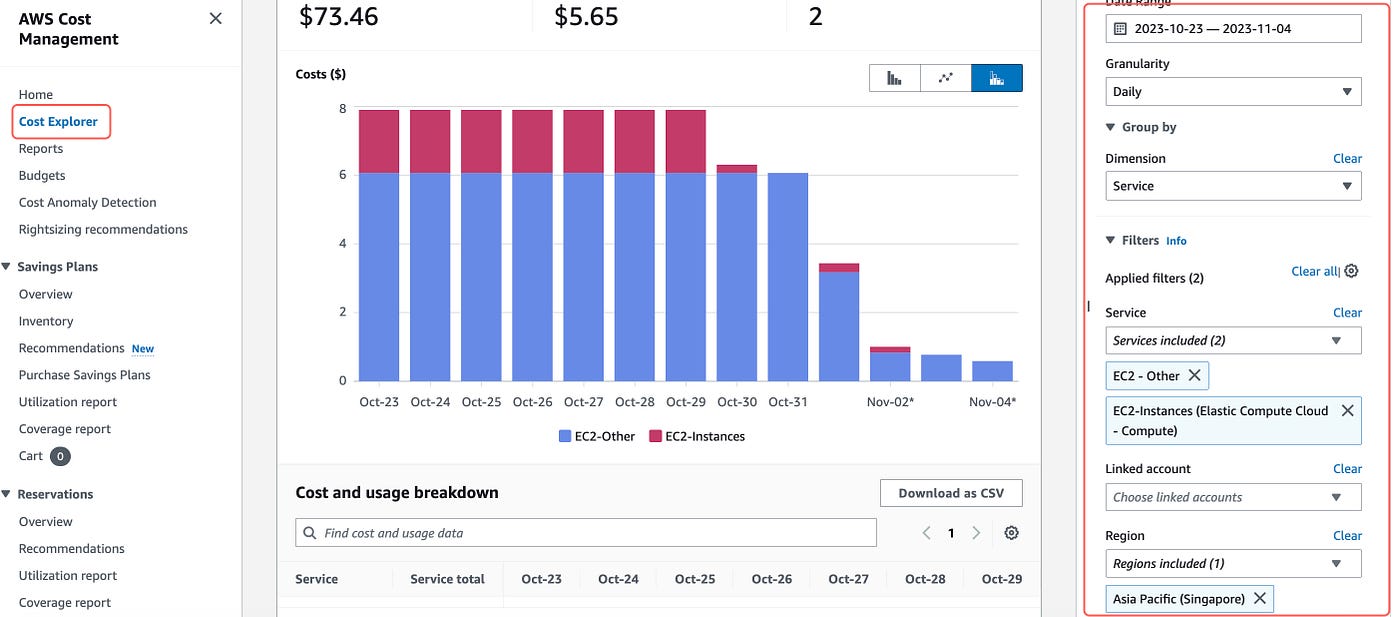
But how can we be so sure that when the EC2-Other cost came down, it was because the NAT Gateway was deleted? Afterall, EC2-Other cost involves multiple other costs as well. So how can I tell it was the NAT Gateway that was optimized? Well, I just used the following filters in the AWS Cost Explorer console to know it for sure.
See, exactly as interpreted before! Now we know the when, lets know the who as well. So who did it?
To find that out, we first need to know which API Action is used to delete the NAT Gateway. I checked the public documentation of EC2 API Reference and found the action to be DeleteNatGateway. (Src. https://docs.aws.amazon.com/AWSEC2/latest/APIReference/API_DeleteNatGateway.html)
This API must have been logged in the Cloudtrail logs. So lets go the the AWS CloudTrail Service. Remember, the region should be Singapore.
Now put the filter as shown below.
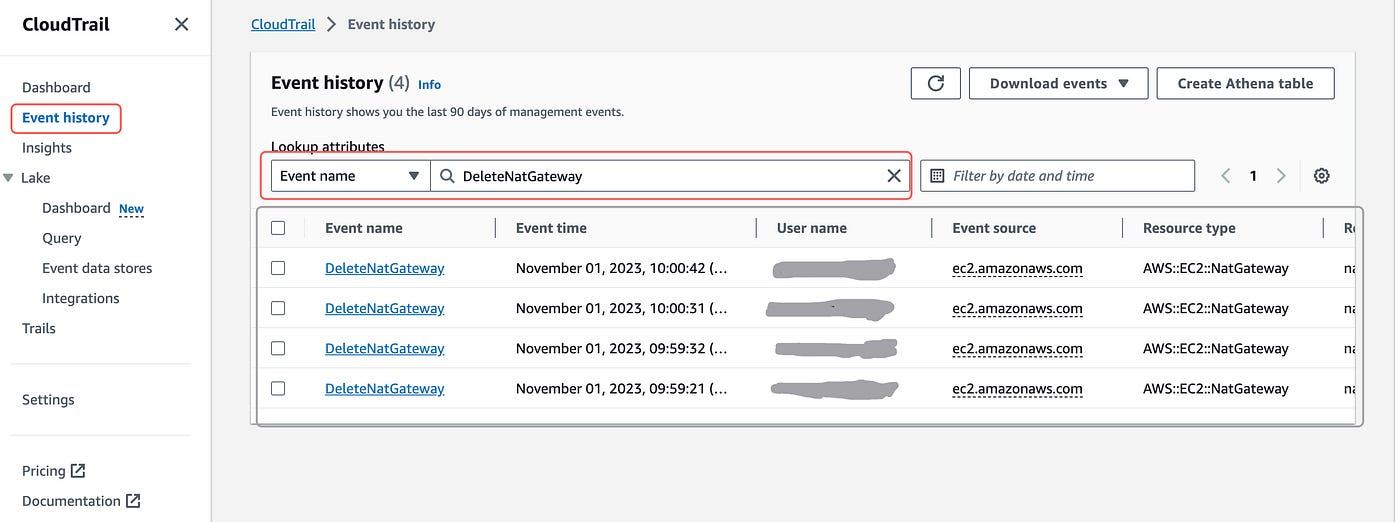
And here I can see four NAT Gateways were deleted by a single user Andy (Username blurred) on November 1, 2023. But who created this these NAT Gateways in the first place? Was it Andy himself? The important question here is, if Andy created the NAT Gateway and deleted it later, then its a good thing that he is keeping track of his resources. However, if it was not Andy who created the NAT Gateway, then there is a disconnect that needs to be addressed. So lets see who created these Nat Gateways.
Before going there, lets note the details of each of the four NAT Gateways. That way, we can pair the CreateNatGateway and DeleteNatGateway action for all four NatGateways. Just click on the Event DeleteNatGateway in the above shown screenshot, and under Resources Referenced table, under Resource Name attribute, there is the NatGateway ID.
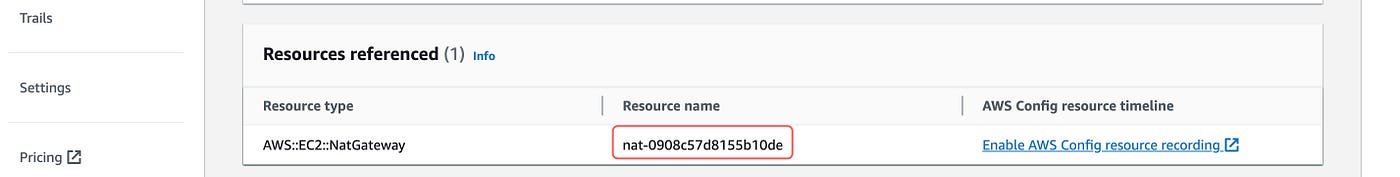
Copy this ID for all four NAT Gateways.
Now lets look for CreateNatGateway Event in Cloudtrail.
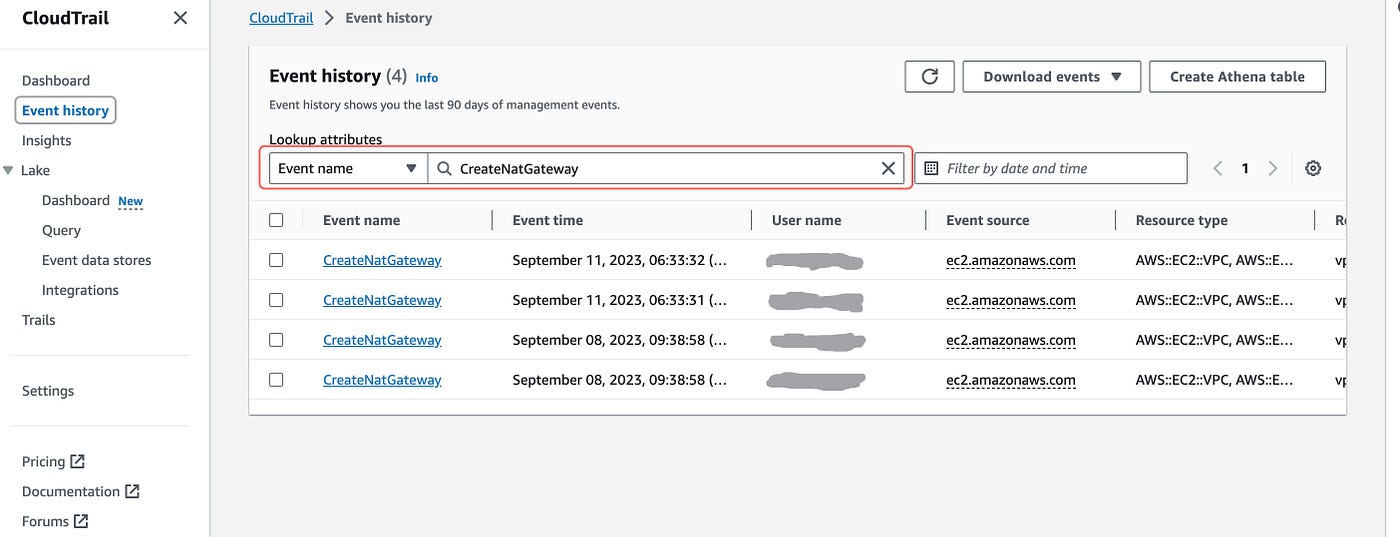
If you tally the NAT Gateway IDs noted earlier, it is same for these four Gateways. And to my surprise, I found that it was not Andy who created these NAT Gateways but it was Alex, another user. These NAT Gateways were created on September 8 and 11. So these NAT Gateways incurred charges for almost 2 months. Now the question to Alex can be: What was the outcome of this development activity in last two months?
So we were able to hold Alex accountable for maximum of the expense in EC2 in Singapore region for last two months. We will continue this hunt in the Part II of this blog, where we dive deep into Mumbai region, and others. Note that I have not gone deep into other small costs like Elastic IPs, or EC2-instances because its better to invest most of your time on major cost drivers first. So see you in the next part!